We released the Business Intelligence (BI) API in mid 2022 and have seen increased usage of the API every month since its launch.
While PPO has a large number of standard reports and dashboards the BI API places the power in the hands of the users to connect their BI tool of choice, whether that’s Power BI, Tableau, Qlik or even Microsoft Excel to their PPO data to create, analyse and publish PPO data for their user community. This allows greater exposure of their project and portfolio data to resources that might not be PPO users or to users in the tool of their choice.
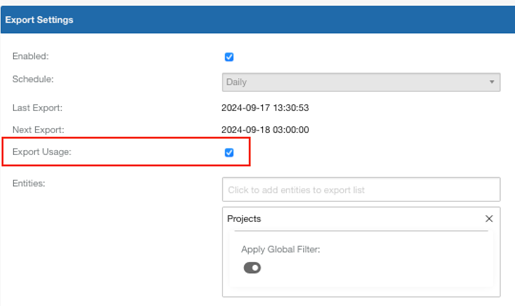
Since its initial launch we’ve added the ability for apply global filters to the entities to reduce the amount of data that users extract and allow them to in most cases focus on active items (projects, tasks, risks, issues etc).
Today we’re launching a new data set to the BI API so that you’re able to analyse usage of PPO. By clicking on the Export Usage tick box that we’ve added PPO will now provide with usage data.

For usage data there are three data sets:
- Usage
- User ID
- Resource / Employee ID
- Date
- Hits (the number of pages loads for that User ID and date)
- Reporting Usage
- User ID
- Resource / Employee ID
- Report Type (report or dashboard)
- Reporting Item Title (the name of the report or dashboard)
- Date
- Hirs
- Users
- User ID
- Username
- Resource / Employee ID
- User Group
- Last Login (the date when last that user logged into PPO)
This functionality is now available to all clients on your live or evaluation instance.
We do our very best to make PPO better every day, so we’d love to hear your feedback on these latest enhancements.
Don’t forget to let us know if you have any other product enhancement ideas! Drop us an email or log an idea on our community portal please. More importantly, keep up to date with all our new product information by subscribing to our blog.


