It’s one of the most common questions we get from our PPO users. Therefore, the idea of this post is to introduce some high-level best practices when producing your PPO Project Manager Dashboard.
But before we get into the detail, there are a couple of factors that influence a good PPO Project Manager Dashboard, so let’s start at the beginning…
Why produce a Project Manager Dashboard?
Not only is project status reporting one of the most vital governance practices for any project, but it’s also a way to keep project executives engaged. When a project manager takes care to produce a project status report that stakeholders will read, this single document can facilitate decision making, problem solving and keep the project moving forward in a positive direction.
How often should the Project Manager Dashboard be produced?
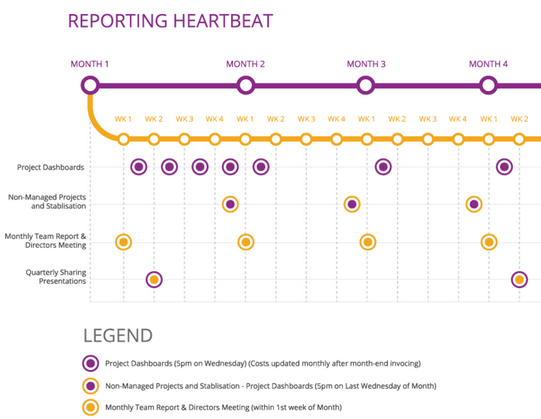
Be on time – if status is not timely, it is meaningless. Project status updates should never be erratic and we encourage our PPO clients to establish a regular reporting heartbeat within the project environment. What does this mean? Stakeholders should come to expect a project manager dashboard in their inbox every Thursday for team reporting and the 2nd Friday of every month for SteerCom reporting as an example.
Taking a closer look at the PPO Project Manager Dashboard
The Project Manager Dashboard provides an overview of all the information on a project in order to provide any stakeholder with a clear view of the project’s current status.
Logical grouping of data – As a rule of thumb, the project objectives, deliverables, benefits and classification of the project are entered upon registration of the project on PPO. Typically, this information should only require occasional updating if decisions are taken that affect the project objectives, deliverables, etc. The phase and status of the project should also be kept up to date in terms of where the project sits within your organisation’s project life cycle. In some instances, the phase and status is updated through an automated project gate approval process.
Once you have added and/or updated all the detailed information on your project, you have the required information to provide a high level summary of the project’s current status by updating the health indicators and comments.
Health Indicators
Good Project Manager Dashboards display data, but a great dashboard provides information. This can be difficult as different project stakeholders have different information requirements. To avoid the dashboard becoming hard to read and full of meaningless non-related information, we’ll share a few key tips.
Think about the audience for the dashboard – The most effective Project Manager Dashboard targets the project sponsor and other senior executives. Your job is to remove the complexity and provide information that is free of jargon in a simple, easy-to-read format.
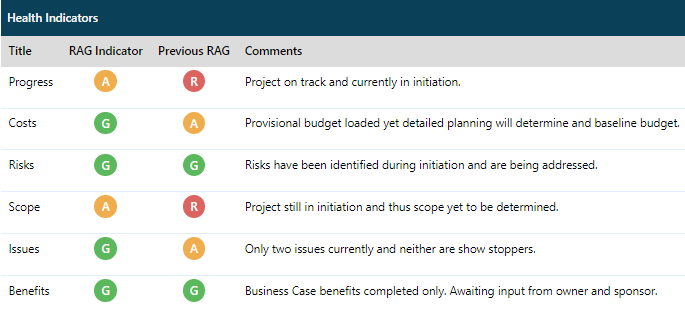
Standardise RAG status descriptions – The PPO health indicators allow the project manager to assign a RAG (RED, AMBER, and GREEN) status supported by a short comment to a specific knowledge area on the project e.g. Progress, Scope, Cost, Benefits, etc. (all which can be customised by the PPO Administrator). Make sure your methodology provides a standard definition and clearly defined criteria for what RED, AMBER and GREEN indicators mean or what % Progress means. More importantly, once you have a standard, get your stakeholders to understand the standards being applied so they are clear on how things are calculated and thus reported on.
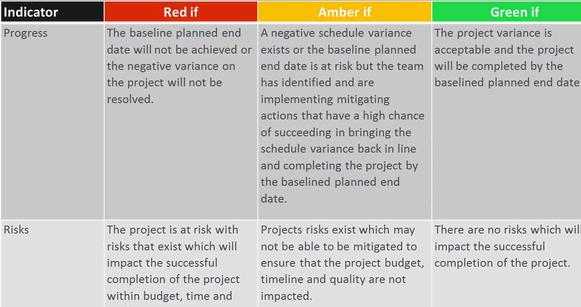
Be accurate – Too often we hear project managers say that nothing has changed on the project in 2 weeks or more and I personally don’t buy this. The project environment is fast-paced and characterised by continuous changes. Nothing is more damaging to a project manager’s credibility than inaccurate (or partial) information. Unless the project has been formally placed on hold, health indicators must be updated weekly (or align to your reporting heartbeat) and should speak to the detail you have entered in the project. The comment should be kept as brief as possible – try to keep to 1 or 2 sentences. Remember, you can’t assign a green RAG to progress if your schedule shows a 30% progress variance!
Comments
Comments are similarly used to provide a section for the project manager to give a subjective view of what is going with the project and should be updated weekly. It’s the primary means for a project manager to “control the project narrative”. As a project manager, you can either take control of the narrative, or you can let the narrative control you. It’s easy to guess which is preferable…
Like Health Indicators, you can customise the number and title of the comments that appear on your Project Manager Dashboard. The most common dashboard comments used are General Comments & Issues, Milestones & Deliverables Achieved this Period and Milestones & Deliverables Planned for this Period.
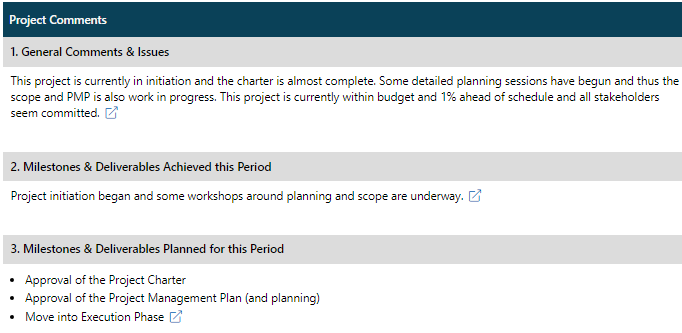
General Comments & Issues – Use this section to highlight anything on the project that was not covered within your health indicators or you want to place emphasis on even though you have already mentioned it in your health indicators section.

Milestones & Deliverables Achieved this Period – List the items achieved/completed during the last reporting period.

Milestones & Deliverables Planned for this Period – List the items you plan to complete in the coming reporting period.
Your reporting responsibility doesn’t stop here, though. Instead of simply pointing out issues to overcome, it should also provide recommendations (and impact of each) that point in the direction of success. The key is to focus your reporting on actionable information, or information that helps your audience see a plan of action.
Remember, good Project Manager Dashboards uncover problems or highlight project challenges, but a great Project Manager Dashboard points toward solutions.
How NOT to update your Health Indicators and Comments
It’s not necessary to include the date before each comment, PPO will keep an audit trial for all records so you don’t need to create it yourself.
The correct way to update the record is to clear the comment field and enter a new comment and assign a new RAG if required.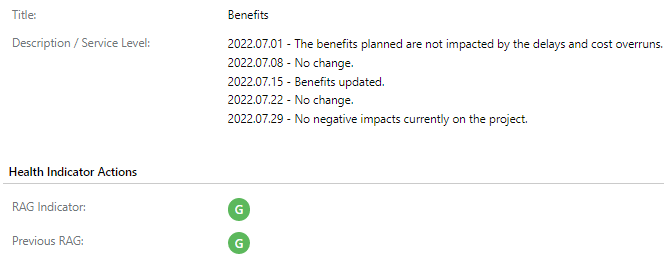
Some of our clients implement the “Auto Clear” option of the Comments free text field. This forces the project manager to sit back and take stock of the project status and provide the latest project status.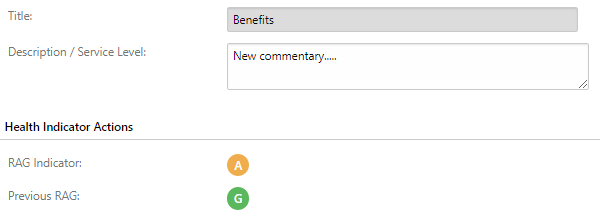
In the event that the RAG status and your commentary remains the same as a previous week (very rarely does this happen), rather provide a reason for why there has been no change since the previous reporting period.
This is done to ensure that PPO registers the change on the record. This is important as it impacts the data quality of the project.
Data Quality
Data quality is determined by the updates to all Health Indicators and Comments and is crucial as it helps the audience of the dashboard to determine the relevancy and accuracy of the information provided. There is no point in consuming the information and making decisions on information that is 30 days old.
Comments Updated: This is a calculated RAG field which indicates whether ALL the Comments on the project have been updated within the last 7 days (Green= Yes, Red = No). The frequency can be amended to align to your reporting heartbeat e.g. last 14 days, last 30 days.
Health Indicators Updated: This is a calculated RAG field which indicates whether ALL the Health Indicators on the project have been updated within the last 7 days. (Green= Yes, Red = No). Like Comments, the frequency can be amended to align to your reporting heartbeat.
Data Quality: If all Heath Indicators and Comments are not updated within the defined period, the Data Quality indicator will turn RED (always shows worst case).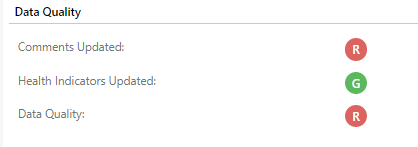
How Health Indicators impact Project Health
Health Indicators drives project health. PPO will assume the worst case scenario from the RAG statuses assigned to health indicators.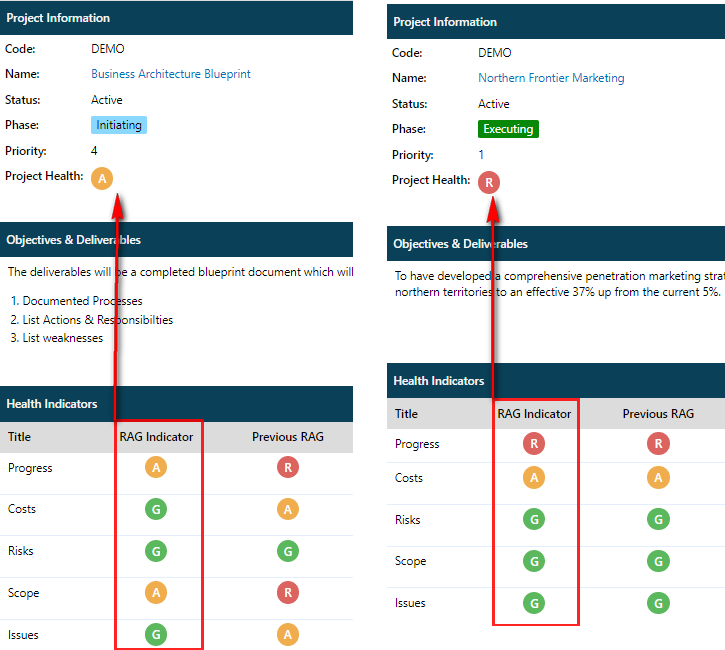
Project- Related Work Items
The Project Manager is accountable for updates to all project related entity items on a weekly basis. A great project manager will motivate the project team to update their items that they’re responsible for.
Tasks/Schedule
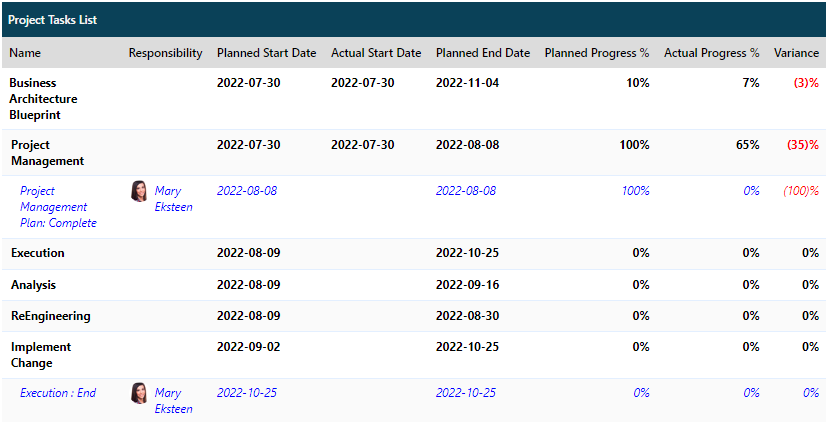
The project’s schedule or tasks section is imported once planning is completed.
MSP schedules should be synchronised with PPO weekly and imported again to ensure the project and summary tasks reflects the correct progress information.
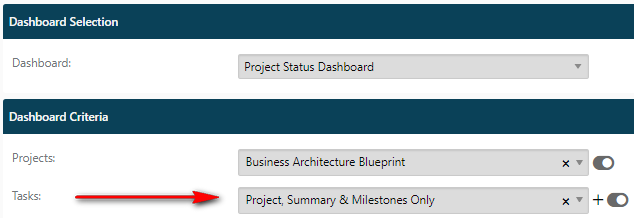
You are able to control the granularity of the schedule displayed on your dashboard by using one of the filter options on the tasks list parameter on the dashboard’s parameters page.
Costs
Costs are updated weekly (or align to your financial reporting process) on a high level (Year and Category), fields to complete is the actual/spent and estimate to complete. Your dashboard will reflect a figure summarised to the cost category.

Other Project-Related Work Items
Depending on the nature of your project environment and the customisation, the items that appear on your Project Manager Dashboard will vary from Benefits, Issue, Major Project Risks, Scope Changes, Decisions, etc. The key is to depict “one version of the truth” to your audience. Keep the records 100% accurate and provide the reader with a level of comfort that you are actively controlling and managing the project activities. Remember, reporting project challenges is a great way to share the responsibility for fixing them!
In summary…
A solid Project Manager Dashboard is one that’s factual, concise, lays out the challenges, details the recommendations, action steps and most importantly, highlights the impending risks that prevent the project from achieving its original objectives.
Get in touch for more tips on how to produce a killer Project Manager Dashboard. And be sure to follow our Blog for further PPO Best Practices on how to deliver more projects successfully.

